Education Level and Individual Values
1.
Background
We
have confirmed that there is a global trend that world citizens are inclined to
expect more on governments. They prioritize disaster response than civil
liberties, public health than economic recovery, and government decisions than
citizens’ requests. Meanwhile, people hold that citizens’ cooperative
participation is of significance under governments’ control since they emphasize
more on rule of law than rule by order, cooperation-centered disinfection than
leadership centered one, and citizens-centered quarantine than
government-centered one. Although there is a trend regarding the government’s
role amid COVID-19 in international society, the fact that no clear tendency concerning
data privacy and data transparency illuminates that the privacy issues are a
sensitive and controversial topic in the middle of a pandemic. In this section,
we will divide global citizens into two groups according to their education level
and see if the variable of it has an influence on individuals’ values.
2.
Research
Topic
Generally speaking, people with different academic
backgrounds have distinguished ideologies in political and economic issues.
Therefore, we will reaffirm if this common sense is also applicable to our
study. Moreover, if two groups of people vary in their individual values, we
will observe how their values differ as to their educational level.
3.
Questionnaire
Used
Survey Question SQ4: “What is the highest
certificate or degree that you have completed? 1. Less than a high school
diploma or its equivalent. 2. High school diploma or a high school equivalency
certificate. 3. College certificate below the bachelor’s level. 4. Bachelor’s
degree (e.g. B.A., B.S., LL.B.) 5. MA degree (graduate school certificate).” We
categorized the former three groups as low-educated people and the latter two
groups as high-educated people.
Other questions have already been quoted
in previous sections.
4.
Major
Outcomes
Table 1: The Number of Low-educated
and High-educated Citizens in 28 Global Cities
The survey reports that there are 7,171
(46.8%) citizens belong to the low-educated group, and 8,141 (53.2%) people are
high-educated among 15,312 global citizens. In this section, we will see if
there are consistent differences in individual values between the two groups.
Figure 1: Bar Graph of Individual
Value Indexes of Global Citizens by Education Levels
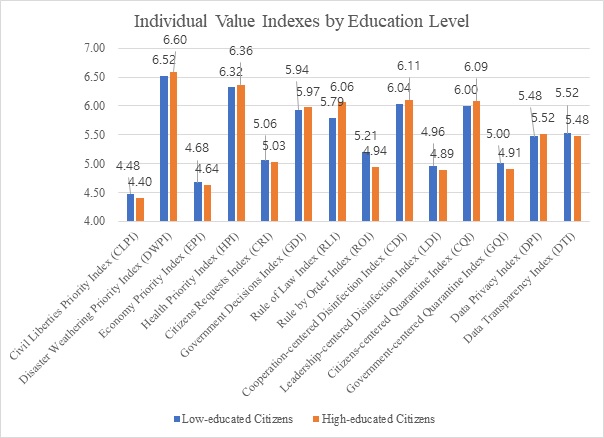
When it comes to
the global trend of individual values, people are prone to value disaster
weathering, social distancing, government decisions, along with rule of law, cooperation-centered
disinfection, and citizens-centered quarantine. The results of the individual
value indexes by different academic backgrounds are of interest since the
result is right opposite to the data analysis results according to the economic
level. For instance, in the previous analysis, most of the lower class
emphasized disaster weathering, social distancing, citizens’ requests, rule of
law, cooperation-centered disinfection, citizens-centered quarantine. On the
other hand, most of the high-educated citizens are highlighting these values,
except for citizens-centered disinfection. Low-educated citizens value more on citizens-centered
disinfection than high-educated people.
Below figures are
bar graphs of each index of each city. The calculation method is that the score
of high-educated citizens minus that of the low-educated citizens, and
therefore, if the result values are negative, it implies that the low-educated
people think more highly of the corresponding ideology than high-educated
individuals and vice versa. Moreover, the results below indicate that there is
no consistent change in global cities, which means that some ideologies are
emphasized by high-educated people, and some are highlighted by low-educated citizens.
Figure 2: Bar Graph of Global
Citizens’ Civil Liberties Priority Index (CLPI) by Education Level
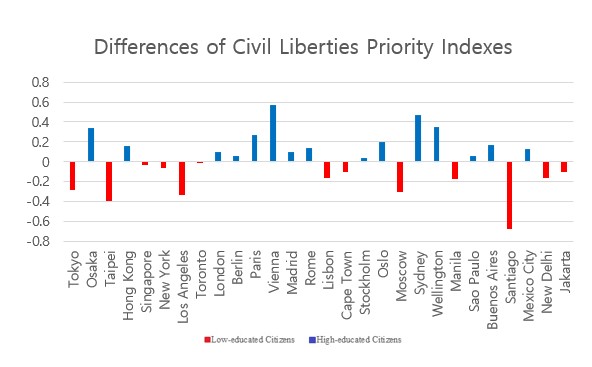
Figure 2 demonstrates
that high-educated citizens gave higher scores on civil liberties than the low-educated
ones in cities such as Osaka, Hong Kong, London, Berlin, Paris, Vienna, Madrid,
Rome, Stockholm, Oslo, Sydney, Wellington, Sao Paulo, Buenos Aires, and Mexico
City. On the contrary, low-educated people gave higher scores on this issue
than high-educated citizens in cities such as Tokyo, Taipei, Singapore, New
York, Los Angeles, Toronto, Lisbon, Cape Town, Moscow, Manila, Santiago, New
Delhi, and Jakarta. To be specific, low-educated citizens in Santiago gave 0.68
points higher than those of the high-educated on the issue of civil liberties.
Figure 3: Bar Graph of Global
Citizens’ Economy Priority Index (EPI) by Education Level
 Figure 3
demonstrates that high-educated citizens gave higher scores on economic
recovery than the low-educated ones in cities such as Osaka, Singapore, New
York, London, Vienna, Madrid, Rome, Lisbon, Cape Town, Stockholm, Oslo, Moscow,
Sydney, Wellington, Buenos Aires, and Santiago. On the contrary, low-educated
people gave higher scores on economic recovery than high-educated citizens in
cities such as Tokyo, Taipei, Hong Kong, Los Angeles, Toronto, Berlin, Paris,
Manila, Sao Paulo, Mexico City, New Delhi, Jakarta. To be specific, high-educated
citizens in Vienna gave 0.76 points higher than those of the low-educated on
the issue of economic recovery.
Figure 4: Bar Graph of Global
Citizens’ Citizens Request Index (CRI) by Education Level
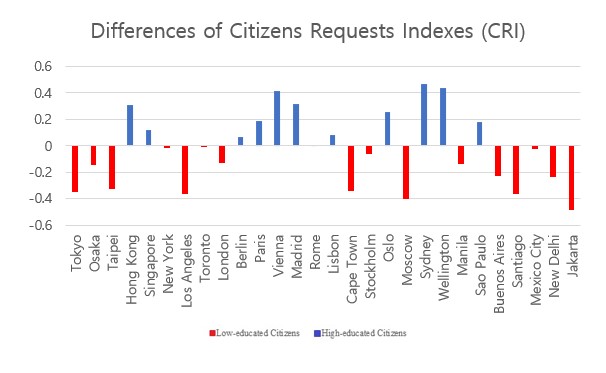
Figure 4 demonstrates
that high-educated citizens gave higher scores on citizens-requests than the
low-educated ones in cities such as Hong Kong, Singapore, Berlin, Paris,
Vienna, Madrid, Rome, Lisbon, Oslo, Sydney, Wellington, and Sao Paulo. On the
contrary, low-educated people gave higher scores on citizens-requests than
high-educated citizens in cities such as Tokyo, Osaka, Taipei, New York, Los
Angeles, Toronto, London, Cape Town, Stockholm, Moscow, Manila, Buenos Aires,
Santiago, Mexico City, New Delhi, and Jakarta. To be specific, low-educated
citizens in Jakarta gave 0.49 points higher than those of the high-educated on
the issue of citizens’ requests.
Figure 5: Bar Graph of Global
Citizens’ Rule of Law Index (RLI) by Education Level
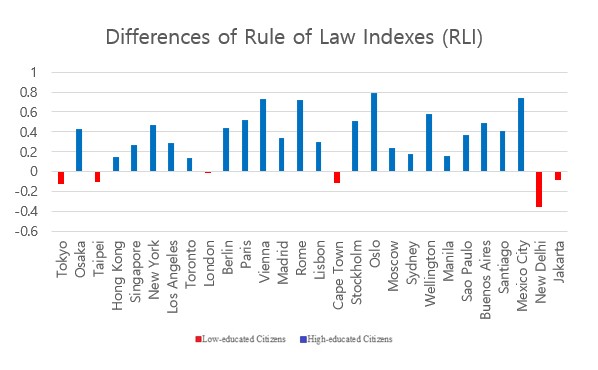
The most
outstanding result shows in Figure 5, which demonstrates high-educated citizens
in most cities gave higher scores on the issue of rule of law. In contrast to
other figures, Figure 5 is filled with blue bars, which implies that
low-educated people gave lower scores on this issue than the high-educated
citizens. Nevertheless, low-educated individuals in some cities, such as Tokyo,
Taipei, London, Cape Town, New Delhi, and Jakarta, gave higher scores on the
issue of rule of law than those of the high-educated. Still, we cannot conclude
that low-educated citizens in these cities highlight more on rule of law since
the numerical differences are trivial compared to other issues. For instance,
low-educated citizens in New Delhi gave only 0.35 points higher than those of
the high-educated, whereas high-educated citizens in Oslo gave 0.79 points
higher than those of the low-educated. Therefore, in-depth quantitative
analysis is required to affirm if high-educated people are emphasizing more on
rule of law than the low-educated citizens.
Figure 6: Bar Graph of Global
Citizens’ Cooperation-centered Disinfection Index (CDI) by Education Level
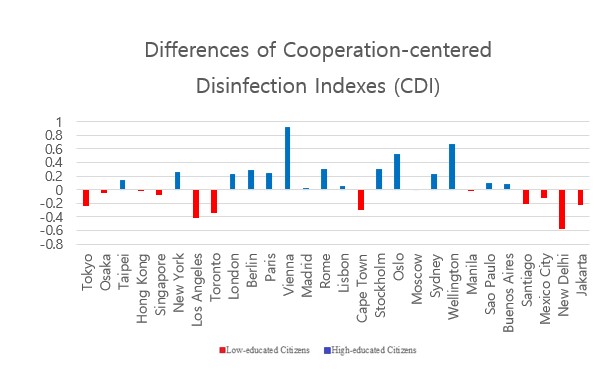
Figure 6 demonstrates
that high-educated citizens gave higher scores on cooperation-centered
disinfection than the low-educated ones in cities such as Vienna, Oslo, and
Wellington. So-called cooperation-centered disinfection lies in citizens’
active trust and cooperation in terms of recovering from the disaster. On the
contrary, low-educated people gave higher scores on this ideology than
high-educated citizens in cities such as Tokyo, Los Angeles, Toronto, Cape
Town, Santiago, Mexico City, New Delhi, and Jakarta. To be specific,
high-educated citizens in Vienna gave 0.92 points higher than those of the low-educated
on the issue of cooperative disinfection.
Figure 7: Bar Graph of Global
Citizens’ Citizens-centered Quarantine Index (CQI) by Education Level
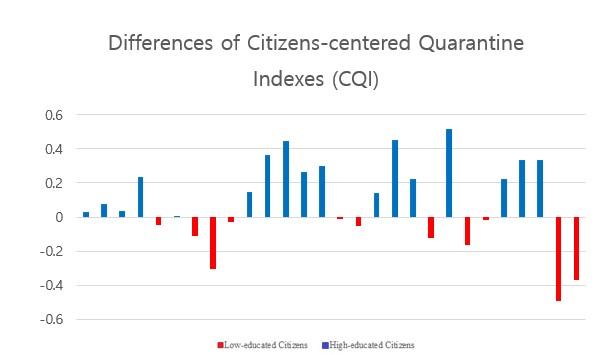
Figure 7 demonstrates
that high-educated citizens in most cities gave higher scores on
citizens-centered quarantine than the low-educated. While in some cities, such
as New Delhi and Jakarta, higher points were given by low-educated individuals.
So-called citizens-centered quarantine means that the citizens are the main
actors in the prevention of an epidemic. Low-educated citizens in New Delhi
gave 0.49 points higher than those of the high-educated on the issue of citizens-centered
qurantine.
Figure 8: Bar Graph of Global
Citizens’ Data Privacy Index (DPI) by Education Level
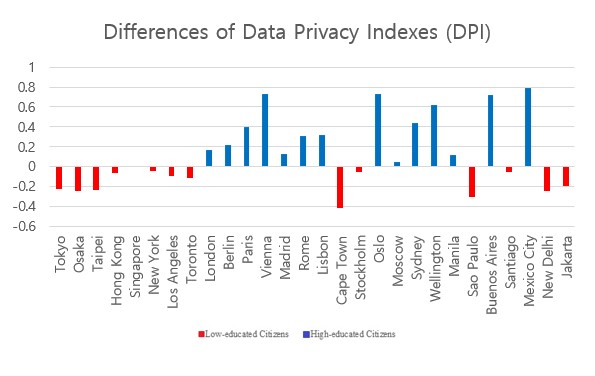
Figure 8 demonstrates
that higher scores were given by high-educated people on data privacy than the
low-educated. This is because the number of blue bars is larger than red bars and
their height is much higher than those of red bars. So-called data privacy, in
contrast to revealing the movement history of infected people in detail, is
protecting people’s personal information, and not to treat patients like
enemies. High-educated citizens in Mexico City gave 0.79 points higher than
those of the low-educated on the issue of privacy.
5.
Summaries
and Further Tasks
a.
Data
analysis shows that the high-educated gave higher scores on the necessity of
government decisions, social distancing, overcoming the disaster, cooperation, and
data privacy in average.
b.
The
most outstanding result in this data analysis of each city is that higher
scores on rule of law were given by the high-educated in most cities. Even
though some cities’ low-educated citizens gave higher scores than the
high-educated, the numerical differences are slight.
c.
The
study is limited to descriptive research, and therefore, a more detailed
explanative investigation is required to further understand the global citizens’
consciousness presented above. Moreover, further quantitative analysis should
be down to assure if there is any significance in this subject. |