Global Citizens’ Satisfaction with Government Policies
during the COVID-19
1.
Background
COVID-19
data analysis 6 series will focus on how global citizens evaluate their
governments’ COVID-19 policies. People’s evaluation is one of the most
important factors in assessing the relationship between government and civil
society. Emergent situations can give a government a large room to control, govern,
and modify people’s daily lives, and therefore, examine how global citizens appreciate
their governments’ policies is of vital significance during the pandemic. In
this data analysis, we surveyed an individual’s satisfaction level with
distinguished policies after the surge of COVID-19, which include COVID-19
information provision, medical care provision, disease spread prevention,
emotional stability assurance, and medical staff safety assurance.
2.
Research
Topic
In the middle of the COVID-19 pandemic, it
is of importance for a government to make a rapid measurement to fight against
the virus. However, it is also of equal significance to think of the ramifications
of democracy within a country. Some strong interventional policies might be
effective in slowing the transmission of the disease; however, there could be
dissatisfaction and complaints raised from the civil society. During this
abnormal circumstance, we will scrutinize at what level global citizens are
content with government policies.
3.
Questionnaire
Used
Survey Question II-5: “How satisfied are
you with your government’s performance regarding the following COVID-19 related
things? 1. Providing information on testing and the prevention of the epidemic.
2. Providing medical care assurance for patients. 3. Preventing the spread of
infectious diseases. 4. Ensuring the emotional stability of the public. 5.
Ensuring medical staff safety.”
The answers consist of a 5-point scale,
with higher scores indicating an individual dissatisfied with the government
policy and lower scores demonstrating a person satisfied with the government
policy in regard to the COVID-19. The reverse scaling was used in this data
analysis, which means that the higher the score, the higher the satisfaction of
citizens.
4.
Major
Outcomes
Table 1: Government
Policy Satisfaction Scores by Region (Scores from 1 to 5)
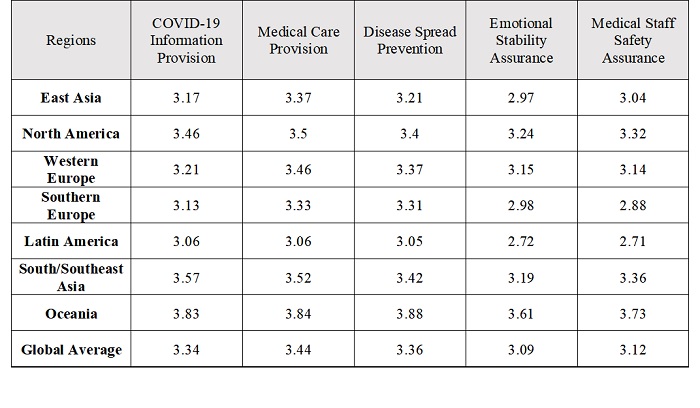
Respondents are asked to choose one score
to represent their level of satisfaction with the policies, and the average
scores of each region are calculated, which are listed in Table 1. It
demonstrates how much people in the region are satisfied with the policy
implemented by their own governments. The below figures are visualized bar
graphs.
Figure 1: Bar Graph of COVID-19
Information Provision Satisfaction Scoresby Region (Scores from 1 to 5)
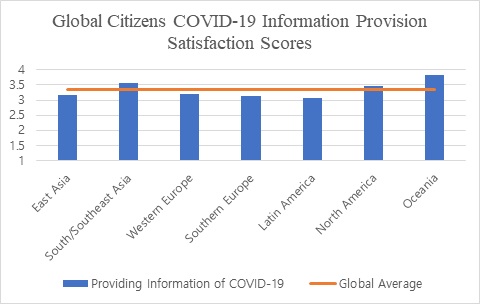
Figure 2: Bar Graph of Medical Care
Satisfaction Scores by Region (Scores from 1 to 5) 
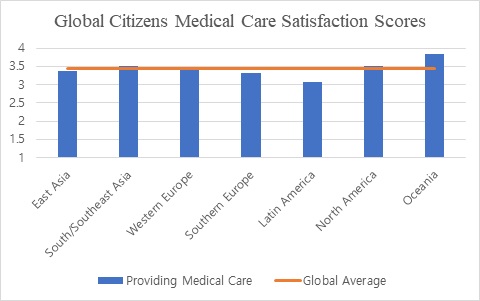
Figure 3: Bar Graph of Disease
Spread Prevention Satisfaction Scores by Region (Scores from 1 to 5)
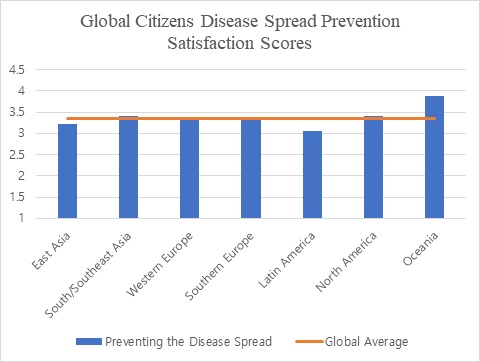
Figure 4: Bar Graph of Emotional
Stability Assurance Satisfaction Scores by Region (Scores from 1 to 5)
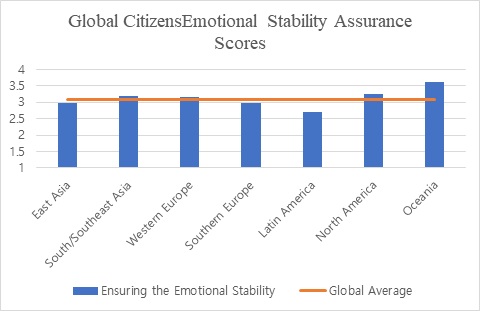
Figure 5: Bar Graph of Medical
Staff Safety Assurance Satisfaction Scores by Region (Scores from 1 to 5)
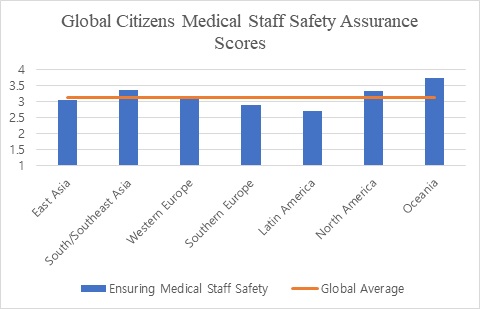
Figure 1 to 5 is
the visualized graph of Table 1, and the orange lines are the global average
satisfaction scores of each policy. That Latin American citizens are least
satisfied with their government performance compared to other regions in the
world is evidenced by the figures. Also, Southern Europe and East Asia’s
satisfaction scores are all under the global average scores, which means that
people in these regions are not very delighted with their governments’
performance compared to others. On the other hand, Oceanian citizens are most
content with their government performance, which is shown in the above figures.
North American and South/Southeast Asian citizens generally gave high scores on
their government COVID-19 policy performance. And then, Western Europe’s
satisfaction scores go up and down the global average line, illuminating that
they are somehow satisfied with the policies implemented by their governments.
Table 2: Government Policy
Satisfaction Scores by Citizens of 30 Global Cities (Scores from 1 to 5)
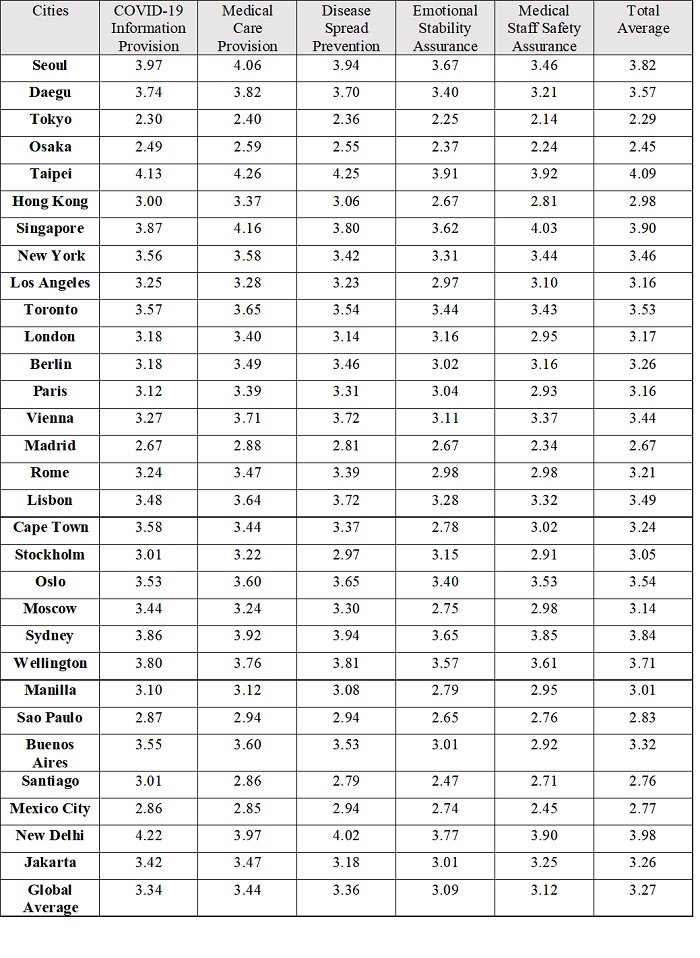
We calculated satisfaction scores by
region to see the general trend of the region and the globe. However, too
generalized scores might have skewed the actual result of the survey, and
therefore, we will look into every city’s satisfaction scores to see if there
is an anomaly or a similar trend in a global society. Similar to Table 1, Table
2 demonstrates how much citizens of a city are pleased with government
performance in regard to a certain policy. The below figures are visualized bar
graphs. For the convenience of reading the bar graph, we decided the 0 points
as a reference line, and therefore each score minus three is the final result
of the below graphs.
Figure 6: Bar Graph of COVID-19
Information Provision Satisfaction Scores by City (Reference line: 0)
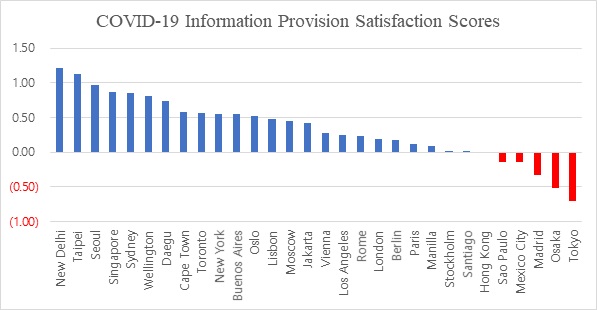
Figure 7: Bar Graph of Medical Care
Provision Satisfaction Scores by City (Reference line: 0)
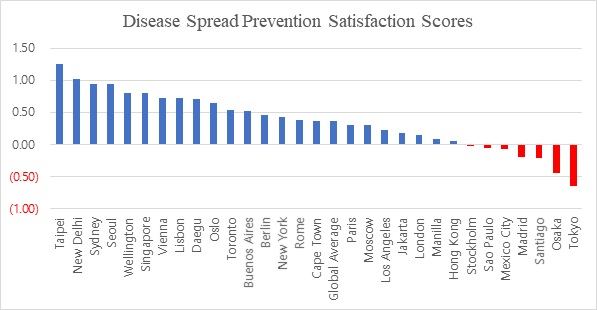
Figure 8: Bar Graph of Disease
Spread Prevention Satisfaction Scores by City (Reference line: 0)
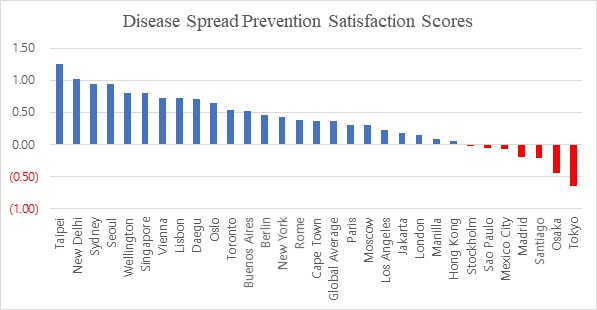
Figure 9: Bar Graph of Emotional Stability
Assurance Satisfaction Scores by City (Reference line: 0)
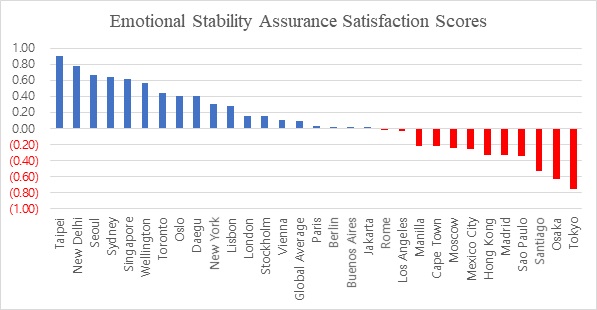
Figure 10: Bar Graph of Medical
Staff Safety Assurance Satisfaction Scores by City (Reference line: 0)
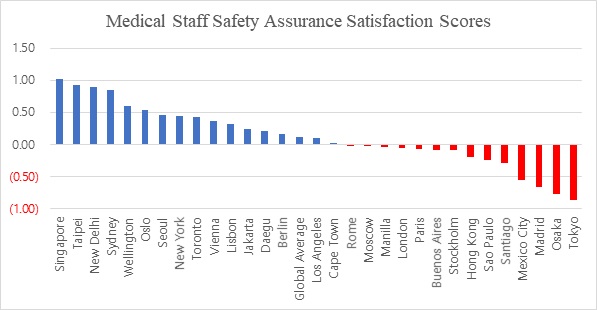
Figure 11: Bar Graph of Total
Satisfaction Scores by City (Reference line: 0)
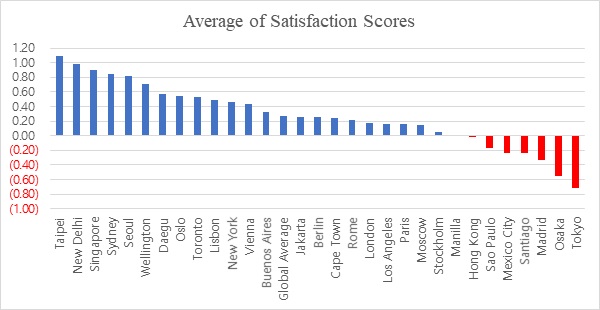
The above figures are visualized version
of Table 2, and the most
outstanding finding of these figures is that Japan, represented by Osaka and
Tokyo, is dissatisfied with its government performance, while other East Asian
cities, such as Taipei, Singapore, Seoul, and New Delhi (South Asia) rated high
scores of their governments’ performance. Hence, the average satisfaction
scores of East Asia cannot fully represent every single city in the region. Also,
South/Southeast Asian’s satisfaction scores might have been skewed since
Jakarta and Manilla’s satisfaction scores are low, while New Delhi’s
satisfaction scores are high, so the overall average would have been high in
the region. Moreover, even if satisfaction scores by Oceania are rated the
highest among different regions, Sydney and Wellington’s satisfaction scores
are not ranked in the first place when it comes to the scores by city.
However, considering
that evaluation culture differs from country to country, we decided to see
their relative satisfaction scores of each policy. The relative satisfaction
score is calculated by subtracting the total average score of a city. To
illustrate, Seoul’s relative COVID-19 information provision satisfaction score
is its COVID-19 information provision satisfaction score of 3.97 minus its
total average score of 3.82, and hence, Seoul’s relative COVID-19 information
provision satisfaction score is 0.15. We calculate relative scores is to see what
policies peoples of a city are least content with among different policies
during the pandemic era. If the relative scores are below 0, it represents that
individuals of a city regard that the policy is not performed well by a
government.
Figure 12: Bar Graph of Relative COVID-19
Information Provision Satisfaction Scores by City
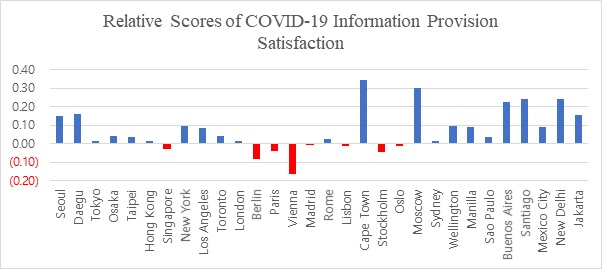
Relatively speaking, Singapore in East
Asia, Berlin, Paris, Vienna, Lisbon, Stockholm, and Oslo in Europe gave low
scores in information provision. Whereas Cape Town and Moscow gave high scores
in this policy satisfaction.
Figure 13: Bar Graph of Relative Medical
Care Provision Satisfaction Scores by City
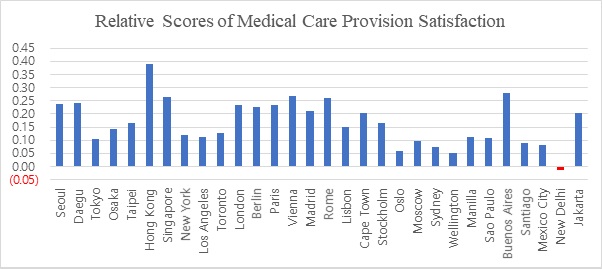
All cities except New Delhi are relatively
content with their governments’ medical care provision.
Figure 14: Bar Graph of Disease
Spread Prevention Satisfaction Scores by City
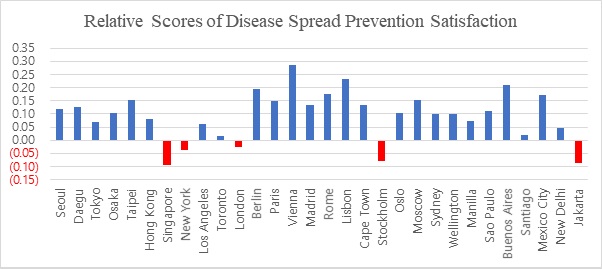
Singapore in East Asia, New York in North
America, London, and Stockholm in Europe, and Jakarta in Southeast Asia are
relatively not satisfied with their governments’ disease spread prevention
performance.
Figure 15: Bar Graph of Emotional
Stability Assurance Satisfaction Scores by City
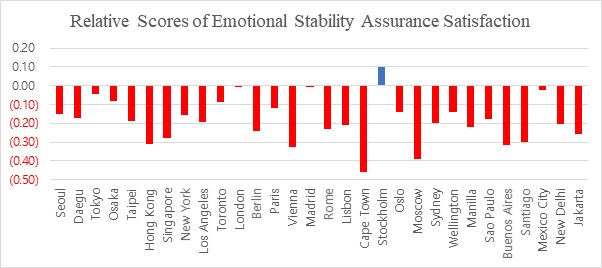
All cities but Stockholm agree that their
governments are less likely to provide emotional stability assurance compared
to other policies during the pandemic.
Figure 16: Bar Graph of Medical
Staff Safety Assurance Satisfaction Scores by City
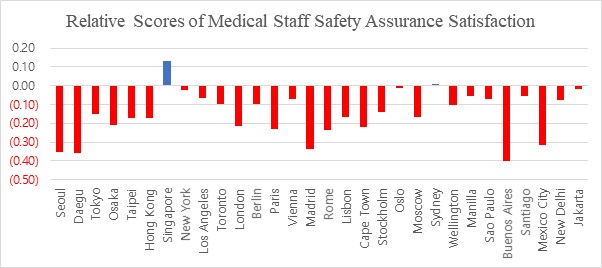
All cities but Singapore are relatively dissatisfied
with the medical staff’s safety assurance by their governments.
All in all,
citizens in 30 global cities relatively satisfied with information provision, medical
care provision, and disease prevention, whereas less satisfied with emotional stability
assurance and medical staff’s safety assurance.
5.
Summaries
and Further Tasks
a.
The
data analysis examines how global citizens evaluate their government performance
by calculating their satisfaction scores.
b.
Two
extremes exist simultaneously in East Asia. Japan, represented by Osaka and
Tokyo, gave the lowest points on all of the policy satisfaction scores. Other
East Asian cities, especially Taipei and Singapore, gave the highest points on policy
satisfaction scores. Also, New Delhi’s satisfaction scores rated high among 30
global cities.
c.
Overall,
Latin America and Southern Europe are generally dissatisfied with their
governments’ performance, while North America and Oceania are content with
their governments’ performance.
d.
Relatively
speaking, global citizens are satisfied with information provision, medical
care provision, and disease prevention, whereas uncomfortable with emotional
stability and medical staff’s safety.
e.
The
study is limited to descriptive research, and therefore, a more detailed
explanative investigation is required to further understand the global citizens’
consciousness presented above. For instance, why citizens in Japan have such
low satisfaction scores? Why people in the world are relatively dissatisfied
with emotional stability assurance and medical staff’s safety assurance? What
are the commonalities and differences among different cities in the world?
|